
Public-document reporting & analysis · Public data & infrastructure
SH-21’s New Debris Flow Report Shows Why Rainfall Windows Matter
A newly added geological report examines July’s debris flows near Grandjean. Its weather records illustrate a practical distinction: a short burst of intense rain and a longer accumulated total answer different questions.
Based on public primary documents. No interviews, site visits, new weather measurements or independent analysis of raw sensor data were conducted. This is an explanation of published evidence, not a current road-condition report or a new hazard forecast.
The Idaho Geological Survey added Staff Report S-26-04 to its catalog on October 20. Written by Zachery M. Lifton and dated October 2026, it examines July debris flows affecting State Highway 21 near Grandjean. The publication is new; the storms are historical. The investigation relates them to the 2024 Wapiti Fire burn scar.
The report combines field observations, images, burn-scar information, hazard assessments and weather records. Lifton visited the SH-21 site on July 23, after the July 22 event. For Idaho readers, one useful detail is how the rainfall information is framed—and why it cannot all be read as the same measurement.
A short-burst scenario is expressed as an hourly rate
The hazard map reproduced in the report uses a scenario with a peak 15-minute rainfall intensity of 24 millimeters per hour. That wording describes a rate over a short interval. It does not mean the scenario requires 24 millimeters to fall during that quarter-hour.
The USGS hazard-map FAQ gives the equivalent directly: 6 millimeters in 15 minutes, or about a quarter-inch. This explains a model input. It is not a finding that this particular storm reached that intensity, and it is not being offered here as a local warning trigger.
USGS describes these assessments as estimates of debris-flow likelihood and potential volume in response to specified design storms. They help examine what could happen under stated conditions. Reading the scenario is part of reading the map.
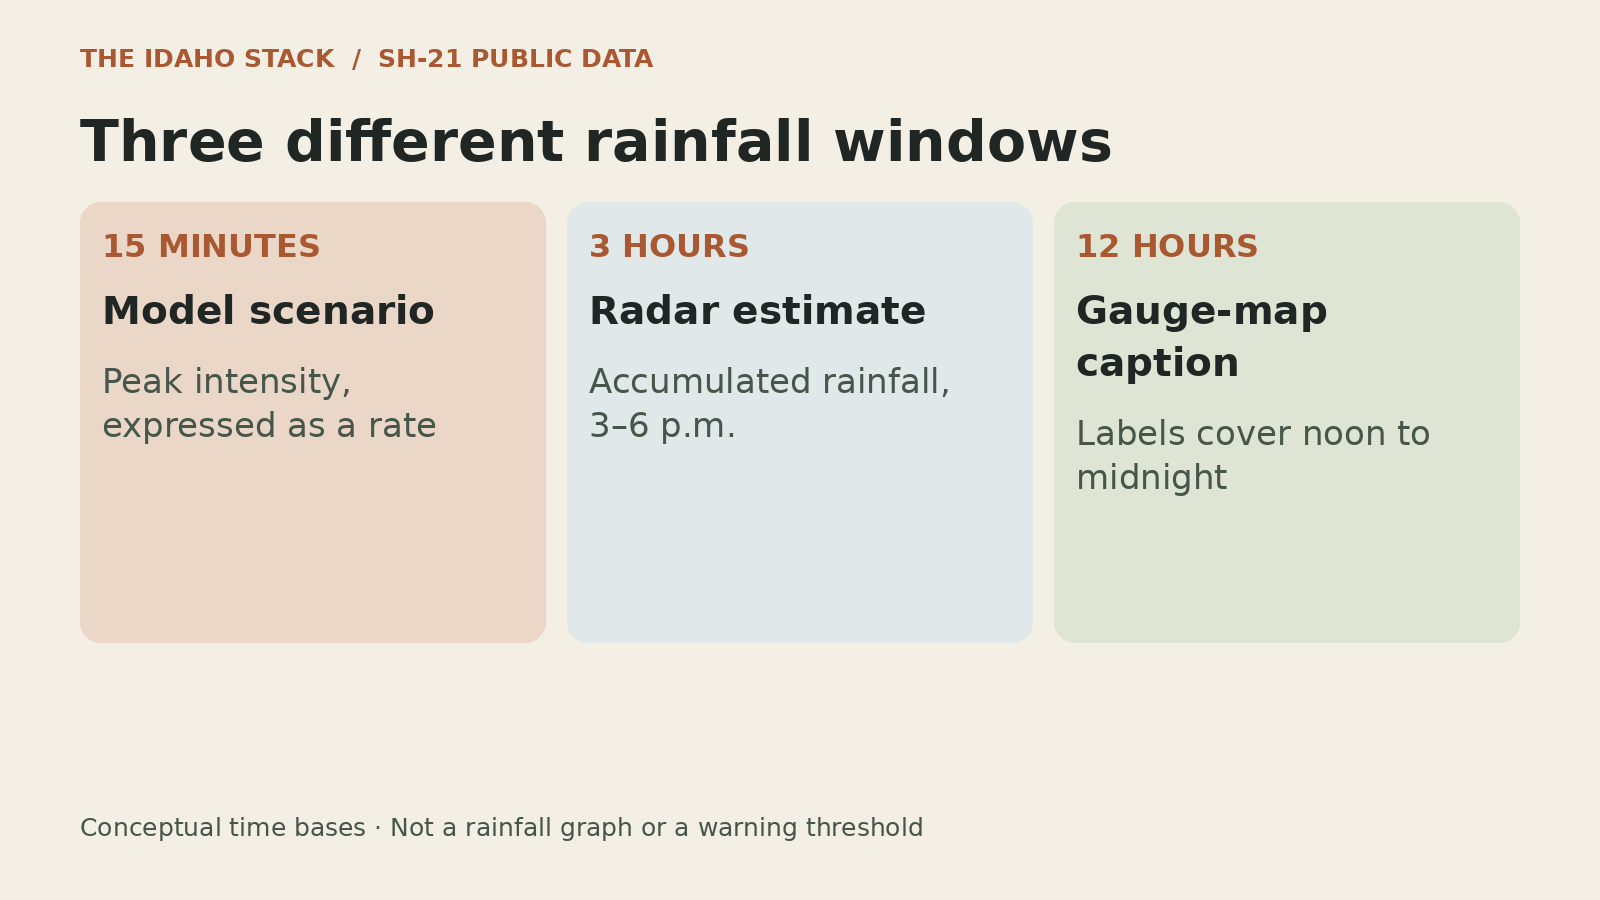
The observed-weather products cover longer windows
NOAA’s Multi-Radar/Multi-Sensor system, or MRMS, combines multiple data streams to produce weather products, including precipitation estimates. It can describe rainfall across an area, with different spatial support from an individual gauge.
The report’s weather discussion and figure 5 caption use the following published time windows. The figure’s times are Mountain Daylight Time.
| Record | Published time basis | What it describes |
|---|---|---|
| Hazard-map scenario | Peak 15 minutes; rate expressed per hour | A selected model input |
| MRMS rainfall | 3–6 p.m., July 22 | An estimated accumulation over three hours |
| Gauge labels in figure 5 | Noon July 22–midnight July 23, as captioned | Displayed observations over a 12-hour window |
An accumulated amount does not reveal how the rain was distributed within its window. The same total could include a concentrated burst or a more even pattern. A three-hour total alone cannot recover an unobserved 15-minute peak.
That limits the comparison a reader can make. We have not reconstructed the raw gauge series or radar fields, aligned their locations and intervals, or calculated whether a particular basin crossed a modeled intensity. The table preserves the published time bases rather than treating them as matched observations.
A monitoring proposal would need to make those choices explicit
The USGS FAQ also explains that actual storm duration, intensity and local conditions can change debris-flow occurrence. Geospatial inputs have limits, and burned landscapes change as they recover. A map’s hazard class is therefore one part of the information needed to understand a particular event.
The IGS report recommends maintaining relevant geospatial information, public education and investigating monitoring and early-warning options. It does not announce a funded or installed warning network.
For this corridor, a useful monitoring proposal would identify which locations a sensor represents, which interval is measured, how that information is interpreted and who maintains the updates. Those are our questions for a future proposal, not a system specification issued by IGS.
The report provides a reason to keep the model, the observation and the decision connected. A rainfall number becomes more useful when its place, period and purpose remain attached to it.
Sources and limits
Primary records reviewed October 27, 2026. The source is an IGS Staff Report; the catalog cautions that these timely publications may not conform to the agency’s standards. Our comparison concerns published measurement descriptions, not an independent validation of the underlying models or event.
- IGS catalog, S-26-04 — author, publication type and October 20 addition.
- IGS report, October 2026 — printed pages 2–4 and figure 5 on page 10 (PDF page 11).
- USGS hazard-map FAQ — design storms, rates and model limits.
- NOAA NSSL MRMS overview — system and product context.
- ITD travel information — the official route to current 511 conditions.
We did not collect or independently reprocess observations, inspect a live monitoring system, assess an individual property or determine today’s SH-21 status. For current road information, use Idaho 511. The July investigation does not establish present travel conditions.